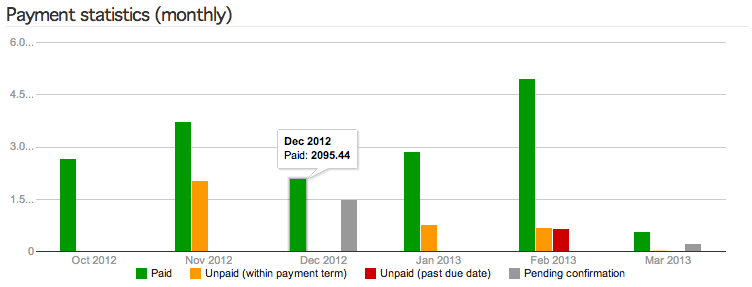
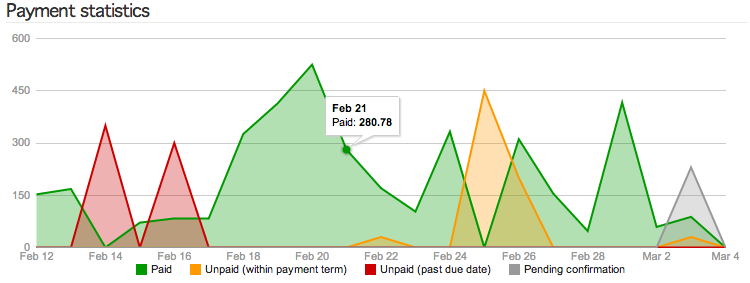
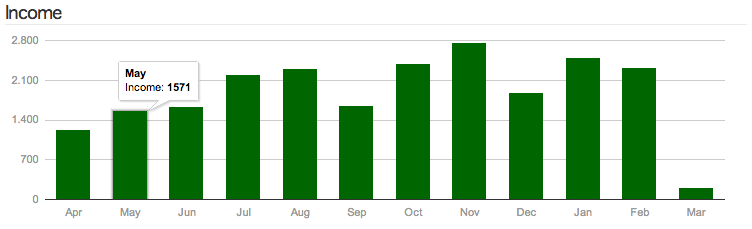
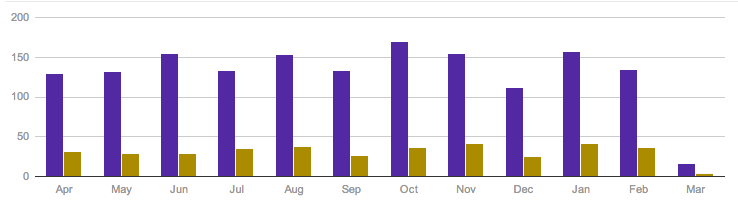
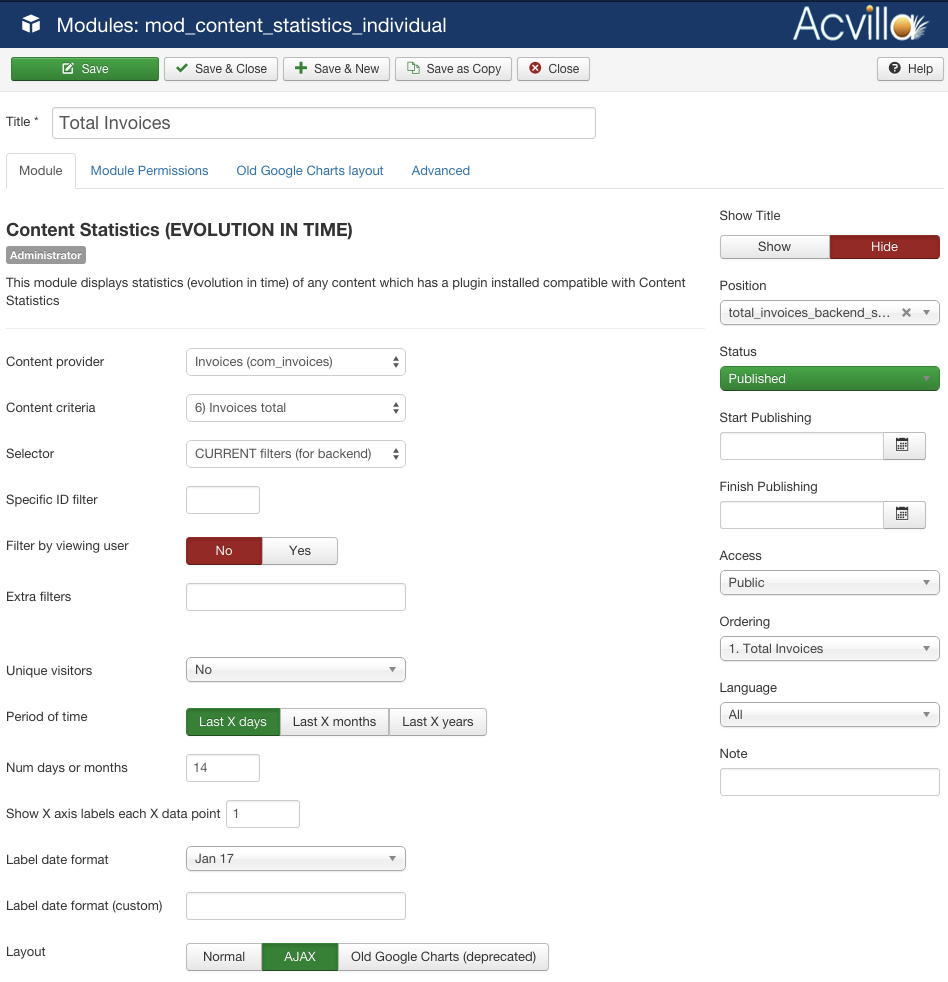
Display Graphic Statistics and reports
Our Invoice Manager is compatible with Content Statistics (sold separately), a handful extension that allows to display graphic charts and reports for your Invoices.
This useful extension will complete your invoicing information for a full report for your business or personal site. You will be able to make beautiful, colorful and interactive graphics (HTML5 and SVG) to display things like:
- Number of invoices created
- Number of payments received
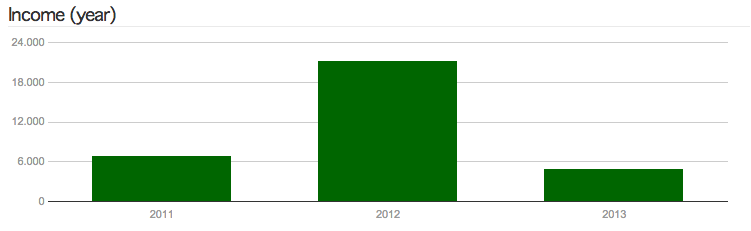
- Payment grossing over a period of time (e.g. how much money did I collect in September?)
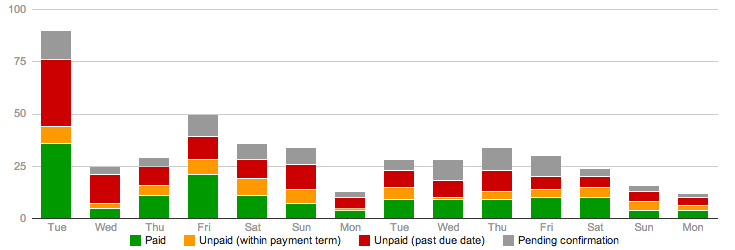
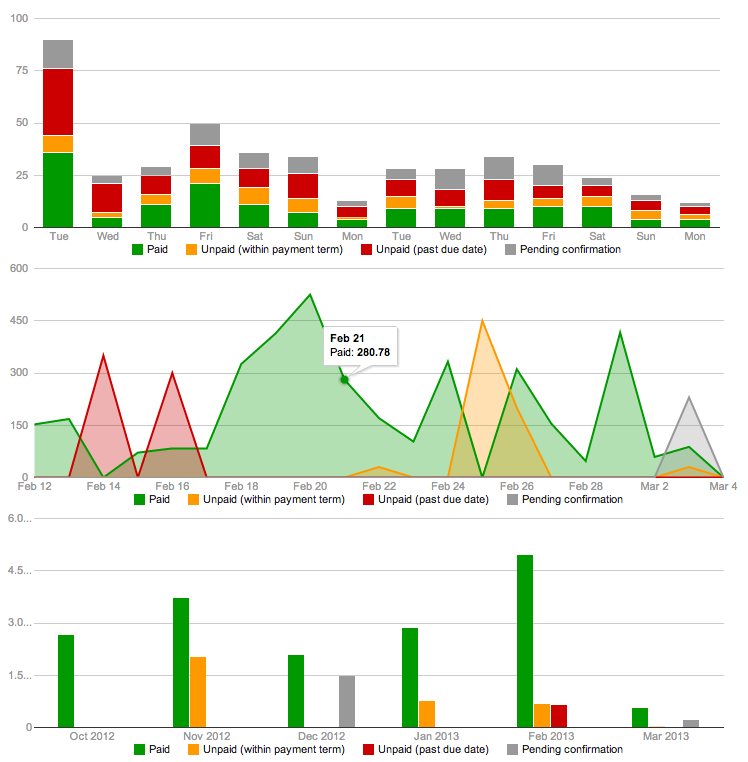
- Payments over due date
- Payments pending to be collected
- Total money generated or invoiced
- Money that your clients owe you
You can display this information using our handy filters:
- "only paid payments"
- "only payments within due date"
- "pending payments"
and of course you can use all the timeline filters:
- Yearly statistics
- Monthly Statistics
- Daily statistics
and an endless of graphic possibilities to render your reports:
- Area charts
- Bar charts
- Step charts
- Line charts